Postingan

IELTS Writing Task 1 - Table (Material, Sample Writing and Exercise)

Gambar
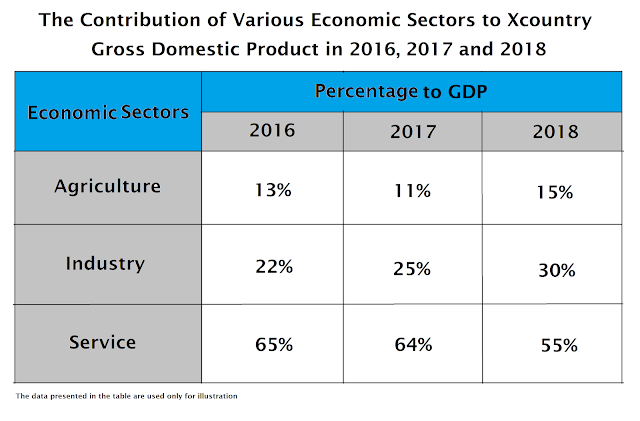
Today, we are going to discuss how a table is described in IELTS Writing Task 1. Previously, we have discussed three other graphs here , here and here . Although the structure of IELTS Writing Task 1 is pretty much the same, we have to always remember that the difficulty level may be different for each graph. For instance, one may find it easier to understand a bar graph, a pie chart and a line graph, but face a lot of challenges trying to describe a table. A table could be too complex too understand and this is one thing that we need to anticipate. For today's discussion, we are going to use a simple table. After learning how a simple table is described, we are going to discuss a more complex table later as an exercise. Take a look at a table below. Table Before we start writing anything, I will try to illustrate how a table could easily be read and how we choose some of the most important components to include in our writing. Take a look at an illustration below. Table The first

IELTS Writing Task 1 - Pie Chart (Material, Sample Writing and Exercise)

Gambar
In the previous articles, we have discussed how line graph and bar graph are supposed to be described. Today, we are going to discuss the pie charts, which are also  commonly used in IELTS Writing Task 1 . In IELTS Writing Task 1, it is possible to have a single pie chart or two pie charts. As far as I know, it is pretty unlikely that we only have one pie chart, because it would mean that there is very little information to be written, making it nearly impossible to write 150 words. So, normally, we have two pie charts or a pie chart and another graph. We're not going to discuss a combination of pie chart and other graph today, since my initial plan was that I would explain every single graph in IELTS Writing Task 1, and then continue with combined graphs. Now, let's take a look at sample pie charts below. Pie Chart The first thing that we need to figure out when doing IELTS Writing Task 1 is how the ideas are going to be structured. What information should be included in parag

IELTS Writing Task 1 - Bar Graph (Material, Sample Writing and Exercise)

Gambar
We have discussed how a line graph is described in the previous post. Today, I would like to discuss another graph commonly used in IELTS Writing Task 1, the bar graph. As I said, I am going to breakdown each graph in IELTS Writing Task 1, and this is the second article that I write. You can read the first article in here , and learn the general structure of writing task 1 in here . Bar Graph Before discussing the bar graph above, let's take a look at the common structure of IELTS Writing Task 1 below: Paragraph 1 - Introduction - Explaining Variables - Explaining Major Trend Paragraph 2 Trend 1 (proportion, lowest/highest point, increase/decrease) Paragraph 3 Trend 2 (proportion, lowest/highest point, increase/decrease) Now, let's discuss how a bar graph should be described step by step. Paragraph 1 Introduction As usual, the first thing that we have to do when doing IELTS Writing Task 1 is explaining what the graph is about. This is done by paraphrasing the original title. Ta

IELTS Writing Task 1 - Line Graph (Material, Sample Writing and Exercise)

Gambar
IELTS Writing Task 1 is one of the two writing tasks in IELTS. You will be asked to describe a graph and write at least 150 words. I have written an article on IELTS Writing Task 1 before, as well as some revised versions of that article. But the explanation is way too general. I just explained the writing structure and gave a sample writing.  From now on, I will breakdown that article into several posts that explain how each graph (bar graph, line graph, pie chart, map, process, and combined graphs) is done. There will be a lot of posts following this initial post, because each graph, or the combination of two graphs, may vary in terms of level of difficulty and trend. We are going to start this long discussion by describing a line graph. Take a look at a sample graph below. Line Graph Before describing the line graph, you should remember that writing task 1 structure is described as follows: Paragraph 1 Overview - Giving a general introduction - Explaining the variables - Explaining